The number is right. The conclusion is wrong.
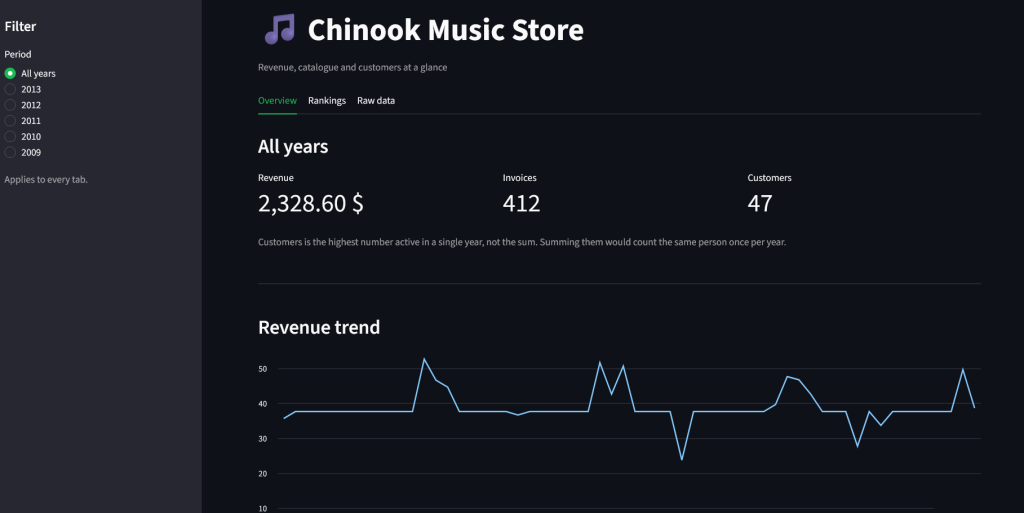
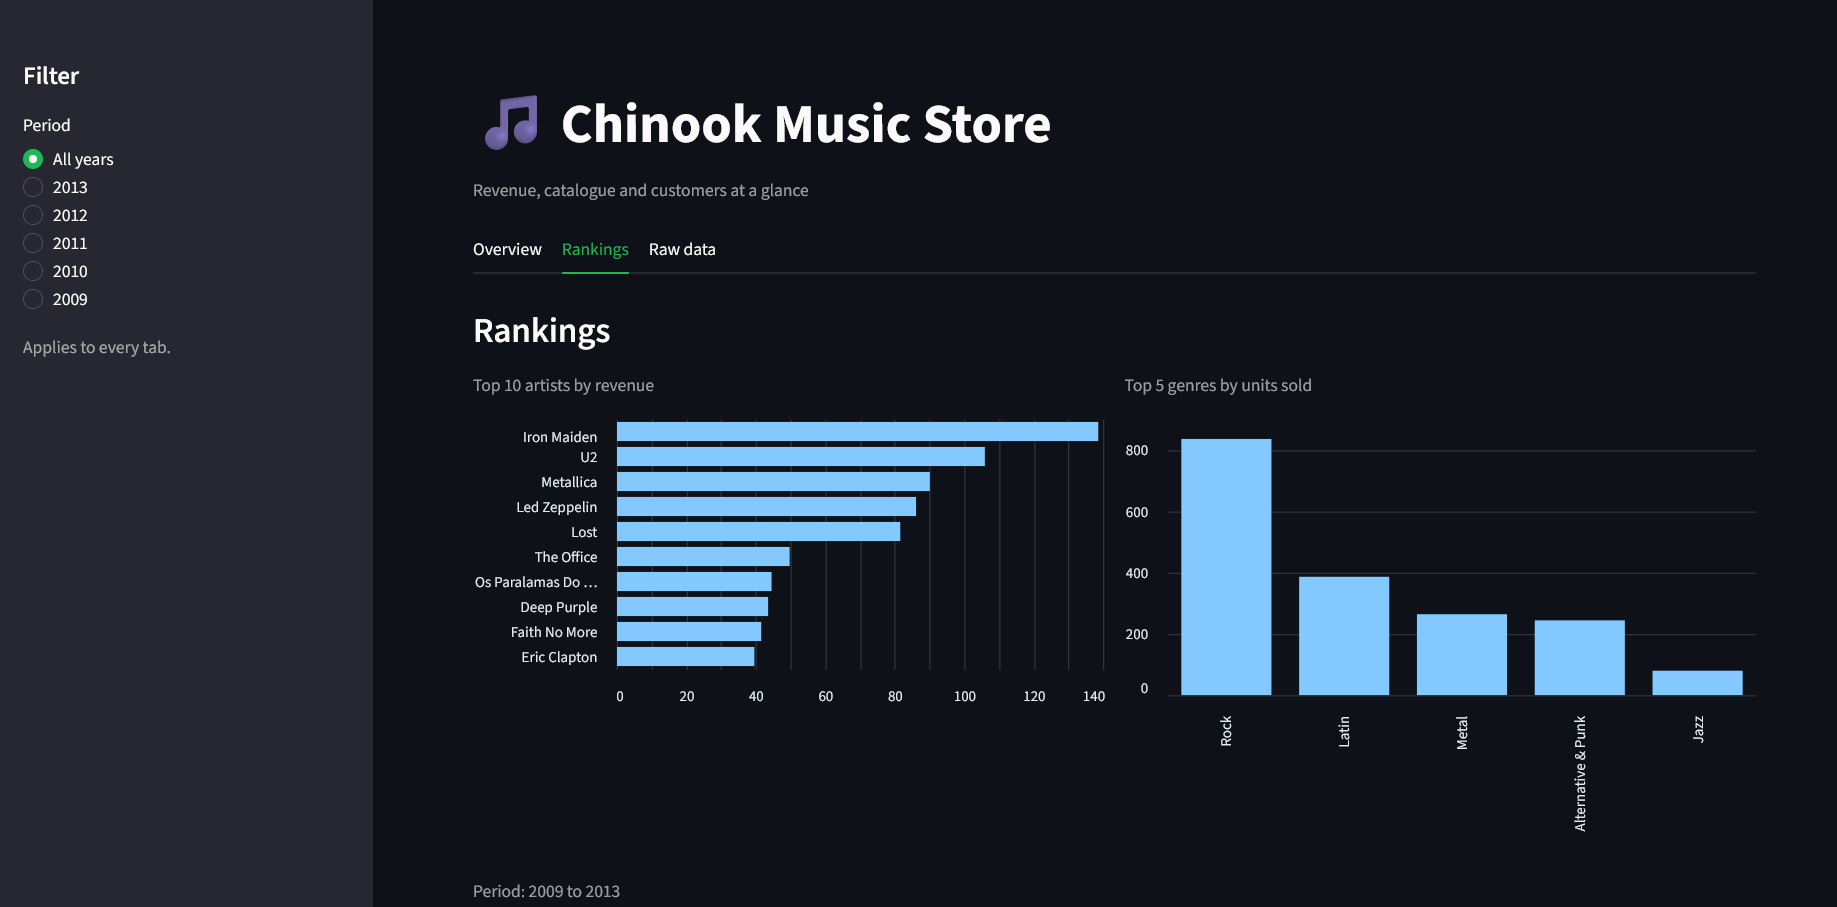
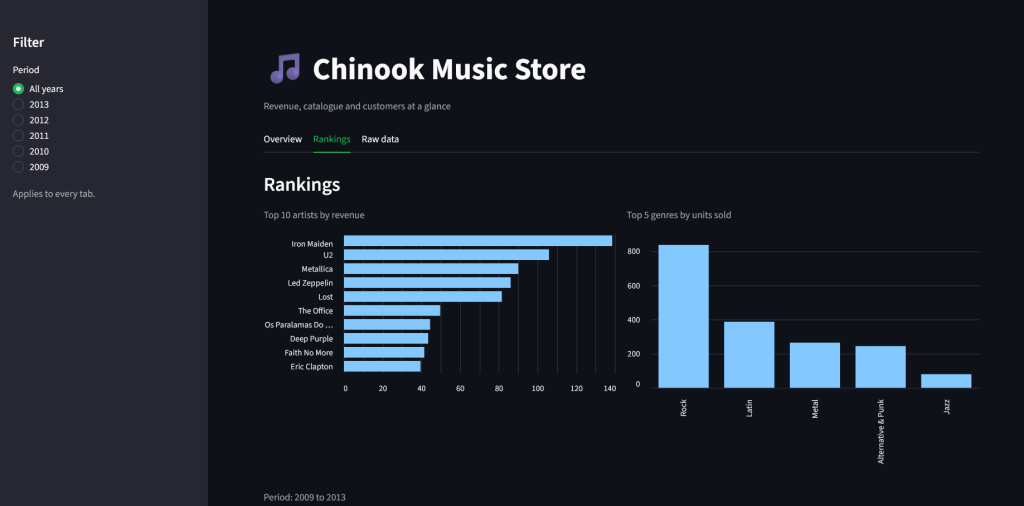
I built a dashboard on the Chinook sample database this week. A fictional
music store, five years of sales, a few hundred invoices. Revenue by year,
top artists, best selling genres. Nothing exotic.
Then I looked at 2013. Revenue down 5.6 percent against 2012, three invoices
fewer, one customer less. A clean story, and an easy one to tell: the store
is losing ground.
It isn’t. The data for 2013 stops on 22 December. Nine days are missing.
Compare a full year against an incomplete one and you get a decline every
single time.
I left that finding in the app instead of quietly fixing it. Select 2013 and
a warning appears above the numbers. The figures stay as they are, the reader
gets the context they need to read them.
The same trap, one card to the left
The second one caught me in the customer count. For the all years view I
first summed the yearly totals and got 232 customers. The store has 59.
The same people come back every year, so adding up yearly figures counts each
of them once per year. The card now shows the highest number active in a
single year, 47, with one line saying why that is not a sum.
Why I keep looking for this
Earlier this year I built a tool that collects job ads from twelve platforms,
removes duplicates and checks them against my own validation rules. It holds
404 verified records today.
The first analysis I ran counted words in job titles. Three words came out on
top, each exactly 90 times. I had the conclusion half written: this is what
the market is asking for.
It was a company name. That company had posted 45 ads.
The data was clean. The arithmetic was correct. The conclusion would have
been wrong, because I had counted advertisements and not employers.
Since then my first question about any metric is not whether it is correct.
It is what exactly is being counted, and against what.
One more decision worth explaining
Revenue per artist is calculated from the price stored on the invoice line,
not from the price in the track catalogue. Those two can differ. The
catalogue holds today’s price, the invoice line holds the price at the moment
of sale. Using the catalogue would quietly rewrite history every time
somebody changes a price.
Small decision, thirty seconds of thought, and the difference between a
number you can defend and one you cannot.
What it is
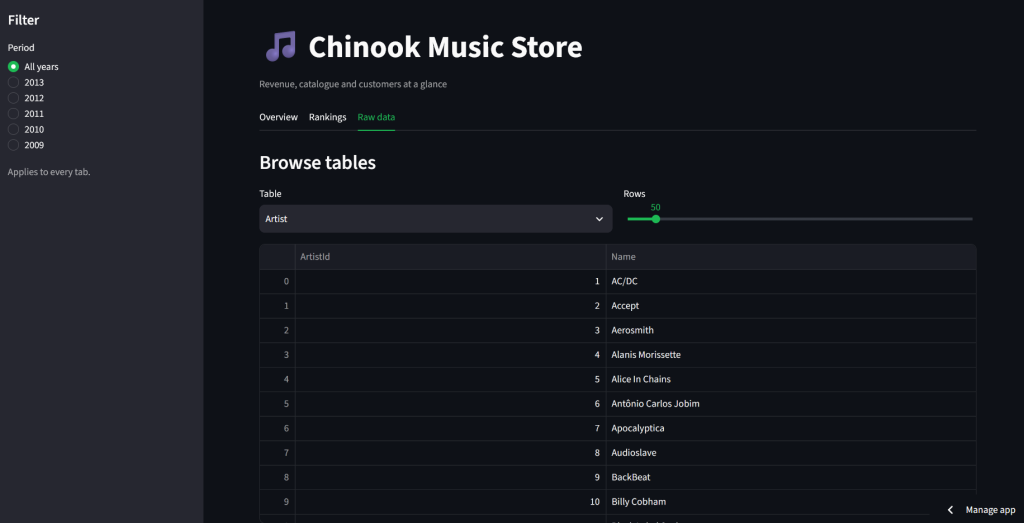
Three tabs. Overview with KPIs and year over year comparison, rankings, and a
raw data browser. One period filter in the sidebar that governs all of them.
Everything is answered in SQL. The period filter is bound as a parameter, not
formatted into the query string, so the database treats it as a value and
never as a command.
Built with Python, Streamlit, SQLite, pandas and SQLAlchemy.