Data analytics project · Azure
Humanoid Robots: Production & Pricing
A self-directed cloud data pipeline researching the global humanoid robotics market: sourced, structured, and made explorable.
The problem
Humanoid robots are one of the most talked-about technology trends of 2025–2026, but reliable, structured data on the industry barely exists. Market research reports contradict each other by an order of magnitude: some cite a $539M market size for 2025, others $5.4B for 2026. No public dataset tracks production volumes or pricing across manufacturers in a consistent, sourced way.
So I built one.
Research & the dataset
I manually researched production and delivery figures, along with pricing, for 20+ humanoid robot manufacturers (Unitree, Tesla Optimus, Boston Dynamics Atlas, Figure AI, UBTech, AgiBot, and others) from company statements, audited financial reports, earnings calls, and industry publications.
Every data point carries a source URL and a confidence rating (High / Medium / Low), because most manufacturers don’t publish official unit counts, and the dataset should be honest about that rather than presenting estimates as fact.
The cleaned dataset is public on Kaggle under CC BY 4.0: Humanoid Robots: Production & Pricing (2025–2026).
Key findings
Production. China accounts for roughly 87% of verifiable delivered units, with Unitree (~5,500) and AgiBot (~5,100) leading in 2025/26. The US lags behind on real shipments: Tesla Optimus has no confirmed external sales yet, and Boston Dynamics’ Atlas hasn’t shipped commercially either; both have announced targets, not deliveries. The dataset draws a hard line between “actually delivered/sold” and “announced/planned,” since several manufacturers are eager to publicize the latter.
Pricing. Entry prices span an enormous range, from $4,290 (Unitree R1-D, consumer) to $170,000+ (Fourier Intelligence, healthcare). Fourier Intelligence, XPeng, and Boston Dynamics sit at the expensive end; Unitree, despite leading in unit volume, stays in the lower price tier: a mass-market strategy rather than a premium one.
Methodology. Every figure carries a source link and a confidence rating, because official manufacturer numbers are rare. The goal was honesty about uncertainty over false precision.
Cloud architecture
Rather than stopping at a spreadsheet, I built a small but complete Azure data pipeline, deliberately combining relational and NoSQL storage sourced from the same Blob Storage layer.
Structured, well-defined data (production figures, prices) lives in SQL tables; flexible, document-shaped supplementary data (manufacturer profiles) lives in Cosmos DB, a simple polyglot-persistence pattern.
Infrastructure, as built
Three stages of the same pipeline, in the Azure portal: raw CSVs landing in Blob Storage, the SQL schema being defined with nullable date fields (so a source that only specifies a year isn’t padded with a fabricated day), and the Cosmos DB account for the NoSQL side deployed alongside it.


Dashboard: production
The first page covers units delivered by manufacturer, production share by country, and a detail table with confidence ratings for every figure.


A DAX-driven “Currently Selected” tile responds to clicks on any visual: same page, one click apart.
Filtering to China alone drops the bar chart from 9 manufacturers to 5 and the pie chart’s China wedge effectively becomes the whole page, a visual way of showing that China isn’t just the largest producer, it’s most of the tracked market. Unitree and AgiBot together account for the bulk of the units in the “Delivered/Sold/Produced” bucket; everything the US-based manufacturers report is either an industry-wide estimate or a stated future target, which is exactly why the dataset separates “Industry total” out from individual company rows rather than blending them together.
Dashboard: pricing
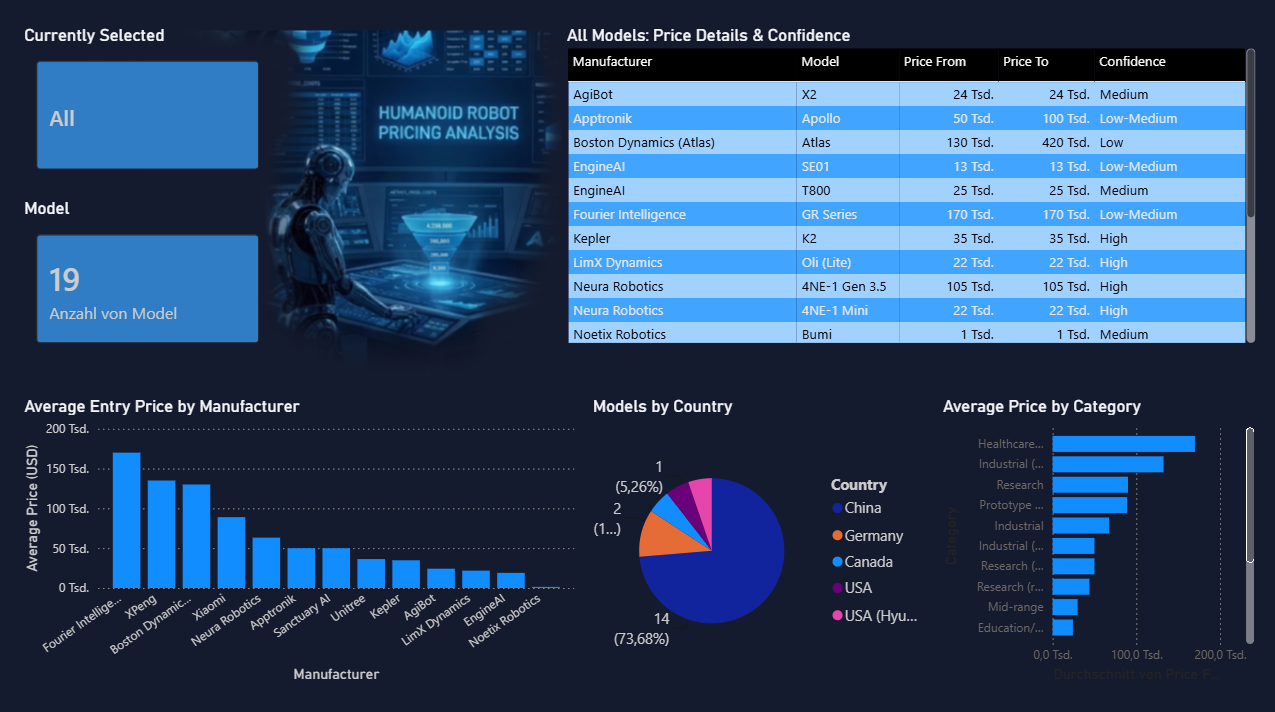
The second page covers average entry price by manufacturer, price range by category, and model distribution by country, cross-filtered the same way.
The pricing picture tells a different story from the production one. Unitree, the volume leader, sits at the cheap end of the market (its entry-level models start around $4,290) while manufacturers with far lower production numbers, like Fourier Intelligence, command prices in the tens of thousands, driven by healthcare and rehabilitation use cases rather than mass-market consumer sales. Filtering to China narrows the field from 19 models to 14, which says something about the pricing dataset specifically: a meaningful share of the publicly quoted, model-level pricing data available right now comes from Chinese manufacturers, since companies like Tesla and Boston Dynamics haven’t published retail prices for their humanoids at all.


Technical challenges solved
- COPY INTO wasn’t supported on this database configuration, the natural way to bulk-load Blob Storage CSVs into Azure SQL. I diagnosed the failure from the actual SQL engine error, not just a portal limitation, and built a Python/pyodbc loader as a reliable alternative.
- Regional availability constraints in Azure meant several core regions were temporarily not accepting new resources, which required troubleshooting deployment across multiple regions for both the resource group and Cosmos DB.
- Delivered vs. planned. Several manufacturers announce ambitious production-capacity targets without having shipped a single unit. The dataset and dashboard separate real transactions from forward-looking claims rather than conflating them.
- CSV integrity. Caught and fixed a batch of rows where unescaped commas inside text fields had silently shifted values into the wrong columns; verified with an automated column-count check across every row before publishing.